A company operating cadence is the drum beat that drives the business. Done well, it sets clear expectations for performance, tracks performance, and identifies improvements to make along the way.
Our operating cadence has three speeds — annual, quarterly, and weekly. Each speed is built on two components, a source of truth and a ritual. A source of truth defines success in a clear, ideally quantifiable way. A ritual is a consistent practice to review that source of truth. Rituals build accountability. Here are the sources of truth and rituals across the annual, quarterly, and weekly operating cadence speeds.
| Annual | Quarterly | Weekly |
| Source of Truth: Scorecards | Source of Truth: Scorecards + WAR Tables | Source of Truth: Corporate Reporting Pack |
| Ritual: Annual Planning Summit | Ritual: Quarterly Business Reviews (QBRs) | Ritual: Exec team weekly meeting |
This document covers these six areas in more detail.
Background Context
Before getting into the details, it's helpful to understand the foundational principles for our operating cadence and our 5 year North Star goals that frame the annual, quarterly, and weekly cadence.
North Star Goals
HashiCorp has three North Star goals that frame our operations. These are the foundational goals that all others are derived from. The exact targets are redacted, but here are our North Star goals:
Win the Hearts and Minds of the Practitioner. XXX monthly active users on our products and services.
Enable the Customer. YYY in annual recurring revenue.
Grow the Ecosystem. ZZZ% of adoption and revenue goals driven from the ecosystem.
Each of these North Stars is equally important to drive a balanced business. Practitioners are the key to technology adoption. Success with practitioners connects us with enterprises, and sets us up to also provide enterprise value to those customers. The ecosystem is a critical aspect for both practitioners and customers. Our ecosystem of product integrations is what makes the "workflows, not technologies" product philosophy real. Our Cloud Partners and SI Partners are key components for our customer journey.
Operating Cadence Principles
Our operating cadence has three design principles.
Federated accountability, central visibility. Company goals need to be segmented properly to surface insights. If goals are too high-level, everything looks average (Simpson's Paradox!). Over-performance in one product line hides the under-performance in another. If goals are too low-level, it creates a ton of measures to track and the signal can get lost in the noise. The key is getting to the right level of segmentation where behavior is meaningfully different for each segment. For us that is by product line and field geography. Then delegate those metrics to the leadership groups for the respective dimensions. The reporting of those metrics should still be central to hold the groups accountable. Federated accountability, central visibility.
Reflection, not perfection. Goals set at the beginning of the year are never completely correct. They're either off in terms of magnitude (too low of a goal or too high) or just completely misguided. The purpose of an operating cadence isn't to dogmatically stick to goals set at the beginning of the year. It's a ritual of reflection and introspection. Are we on track to hit goals? Are these the right goals? What can we do to improve?
Find and enact leverage. An executive team has limited resources. Every quarter we need to diligently prioritize our focus areas. We need to find leveraged improvements. The purpose of leverage is to create as much change as possible with as little effort as possible. This is just like a lever itself — a tool that translates low input force into high output force by increasing the distance through which the force acts. A company only has limited resources and can only have so many priorities. Leverage identifies which changes can have the most positive cascading impacts.
These design principles along with our North Star goals are the context for our operating cadence.
Annual
Source of Truth: Scorecards
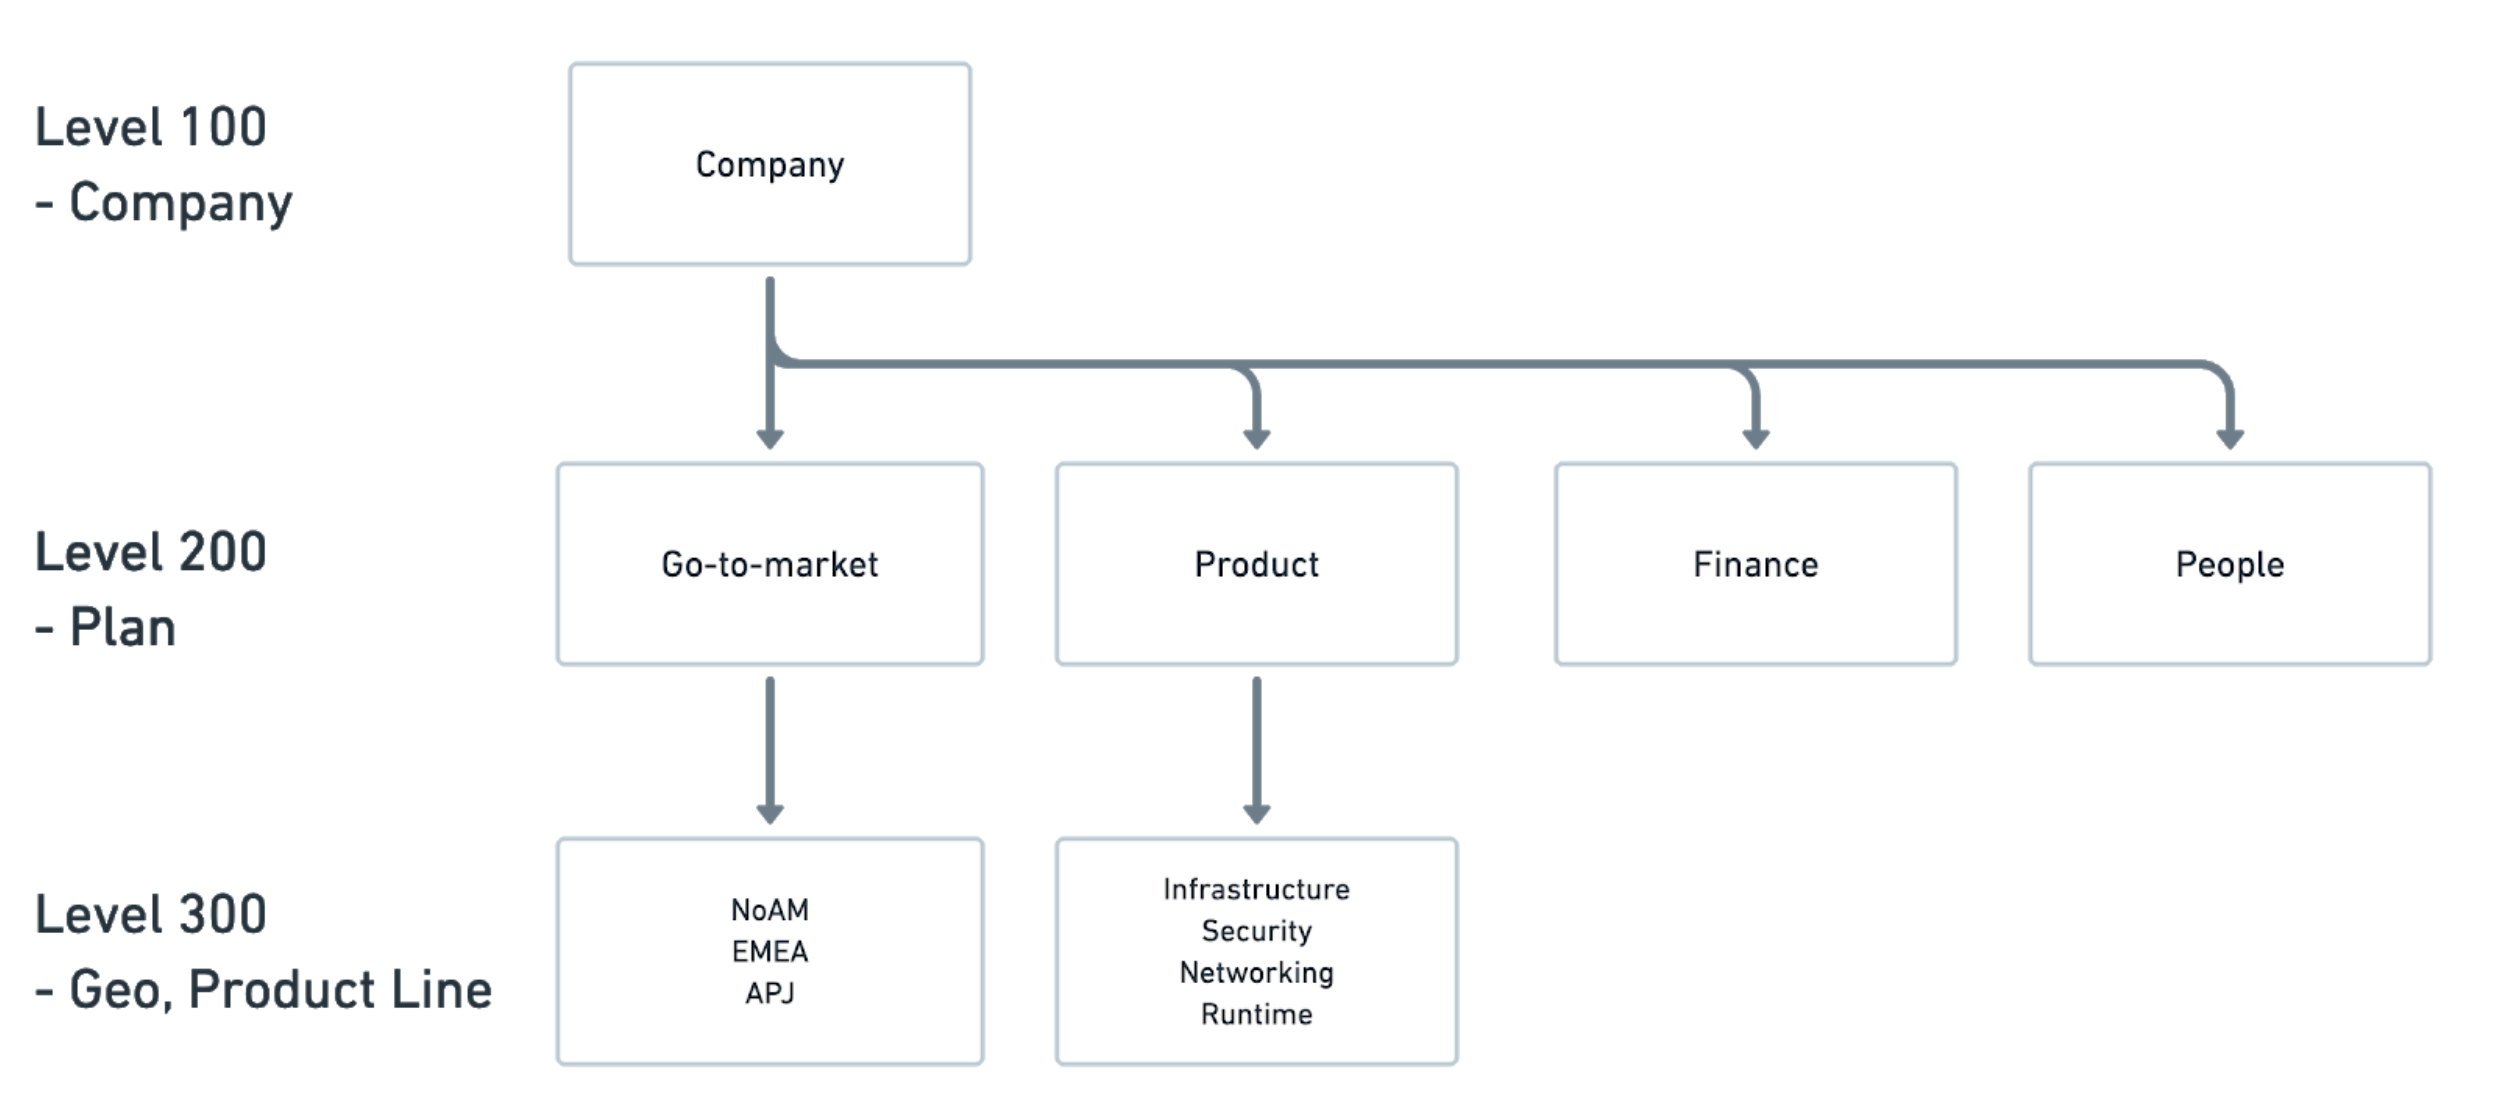
Scorecards are the foundation for the annual operating cadence speed and the operating cadence overall. They cement the objectives and key results for each group. We have 12 scorecards that we track throughout the year. This is in alignment with the first principle of federated accountability, central visibility. We break down our company goals (level 100) into goals by "plan" (level 200) — a go-to-market plan, product plan, people plan, and finance plan. Then the go-to-market plan is broken down (level 300) by field geography (Americas, EMEA, APJ) and the product plan is broken down by product line (Infrastructure, Security, Networking, Runtime). Each one of these areas has a scorecard, with 12 in total.

As the starting point, the company scorecard is defined by the executive team through a structured brainstorm. Each exec comes prepared to the brainstorm with their suggestions for what the company's top 3 priorities should be for the upcoming year, and each person gets 5 minutes to cover their proposal. This structured approach allows each person to have their voice heard, and we are less susceptible to groupthink as each person prepared beforehand. Once each exec shares their thoughts, we merge duplicate suggestions and vote. We take the results from the voting and debate if they're accurate. If so, they get set and measured in the company scorecard. The company scorecard is finalized in October, which then kicks off the Level 200 scorecard work.
Ritual: Annual Planning Summit
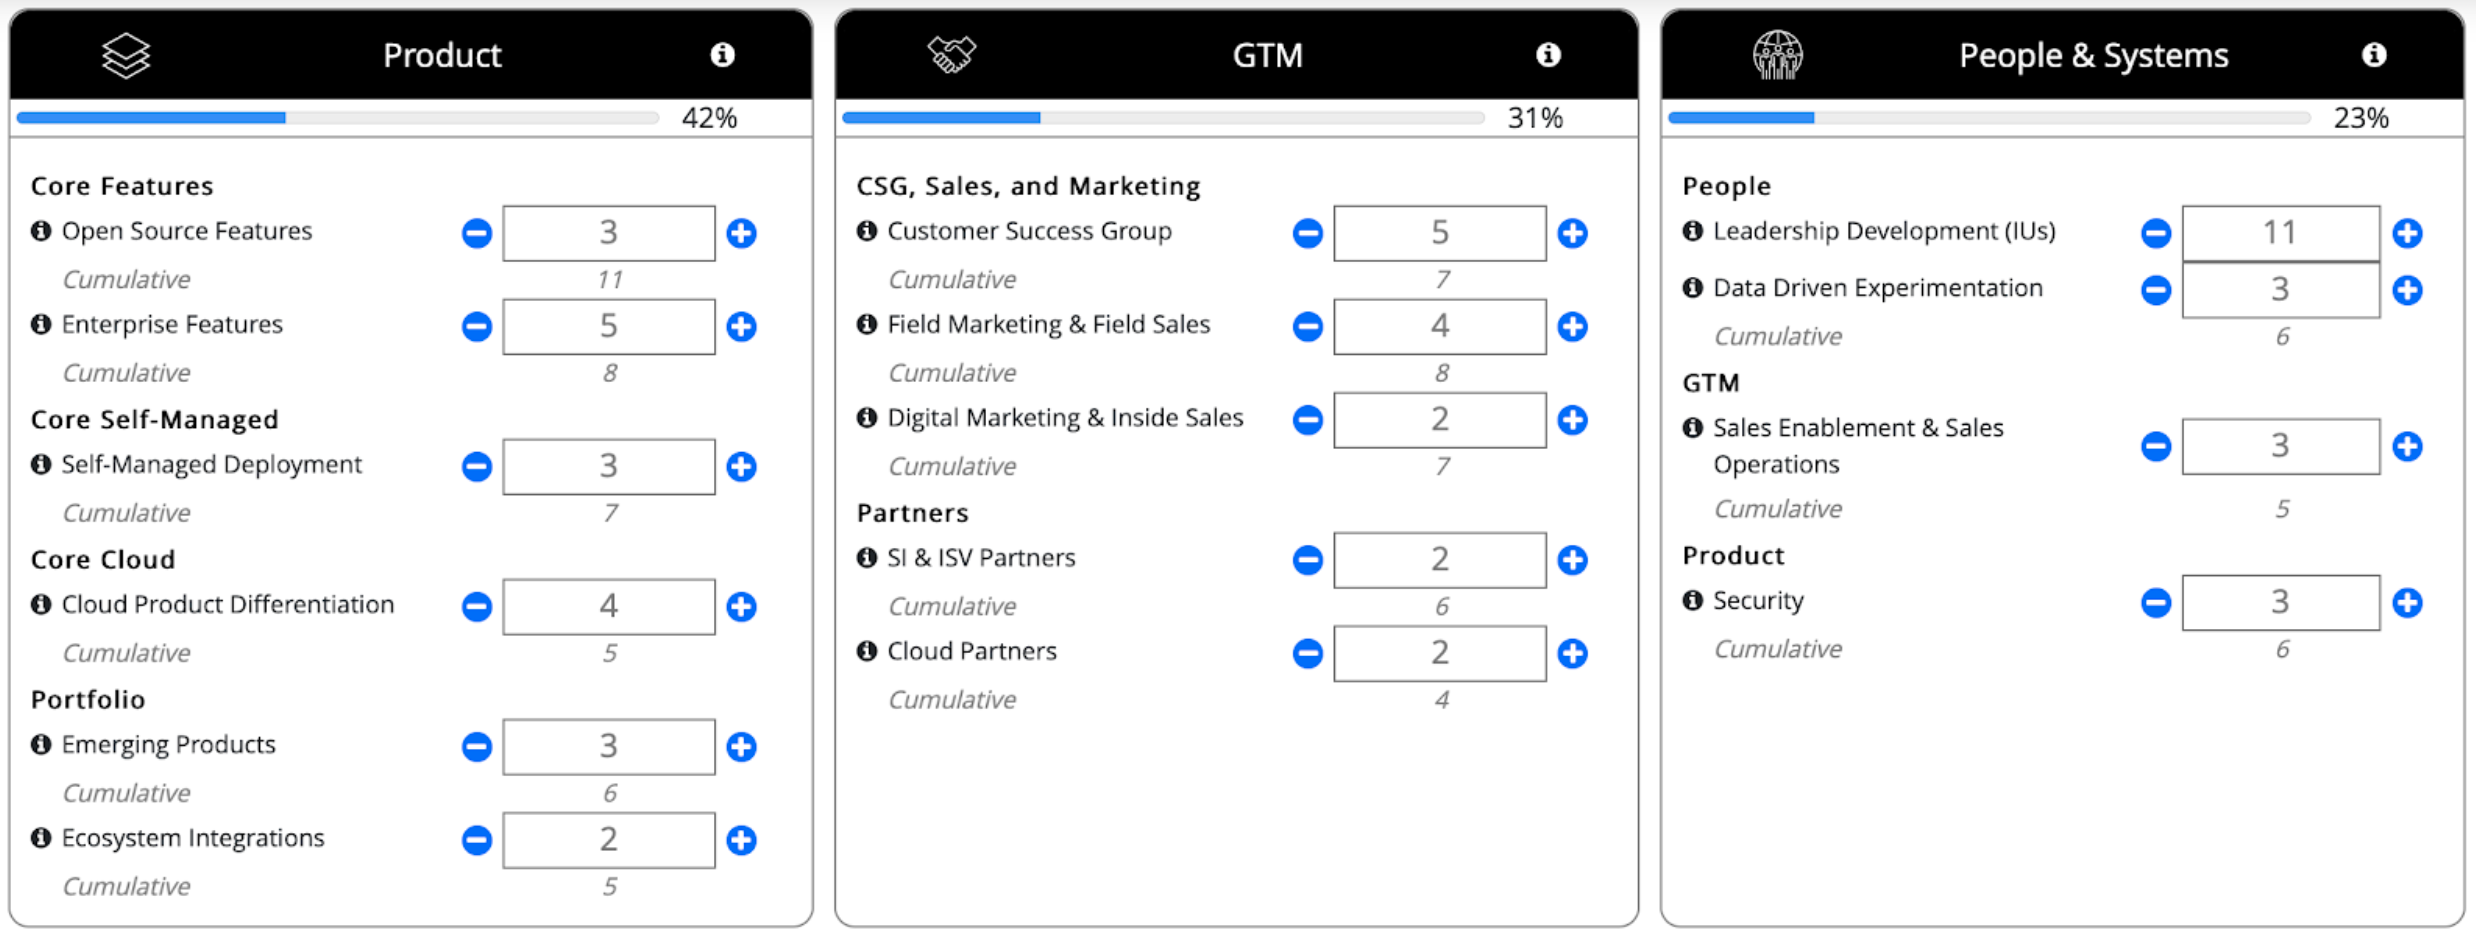
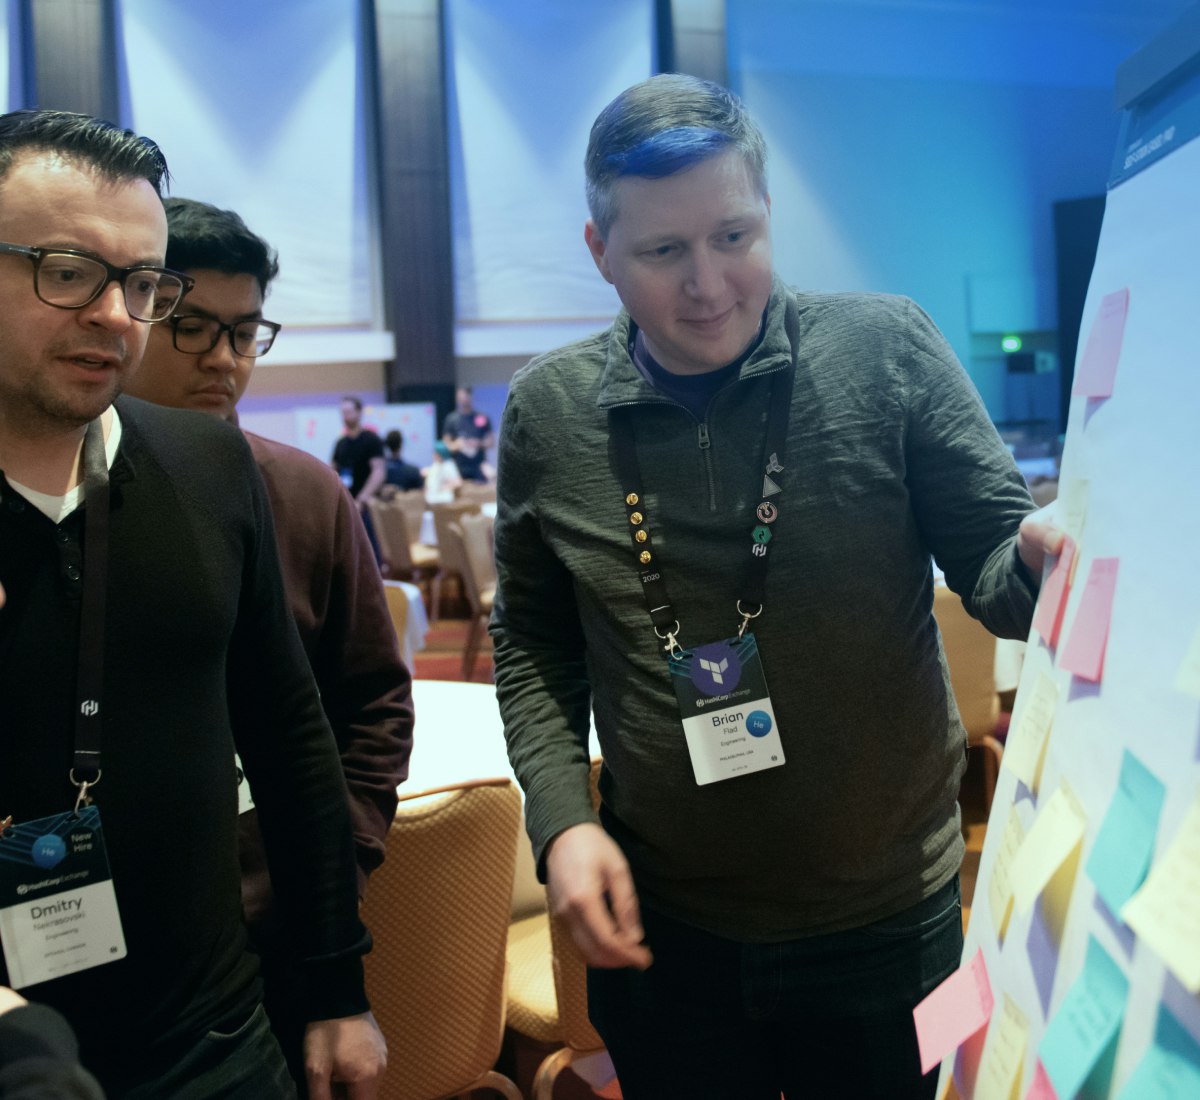
Once the company scorecard has a first draft, we bring together the top ~70 senior leaders to kick off annual planning and discuss the exec focuses. We run a business simulation where teams of 6 leaders get to run a simulated, simplified HashiCorp for 5 years. Each year they determine different investment areas and strategic focuses. Here's the most recent game board for one team's simulated investments:

This is a great way for senior leaders to internalize the executive focuses for the upcoming year.
Quarterly
Source of Truth: Scorecard + WAR Tables
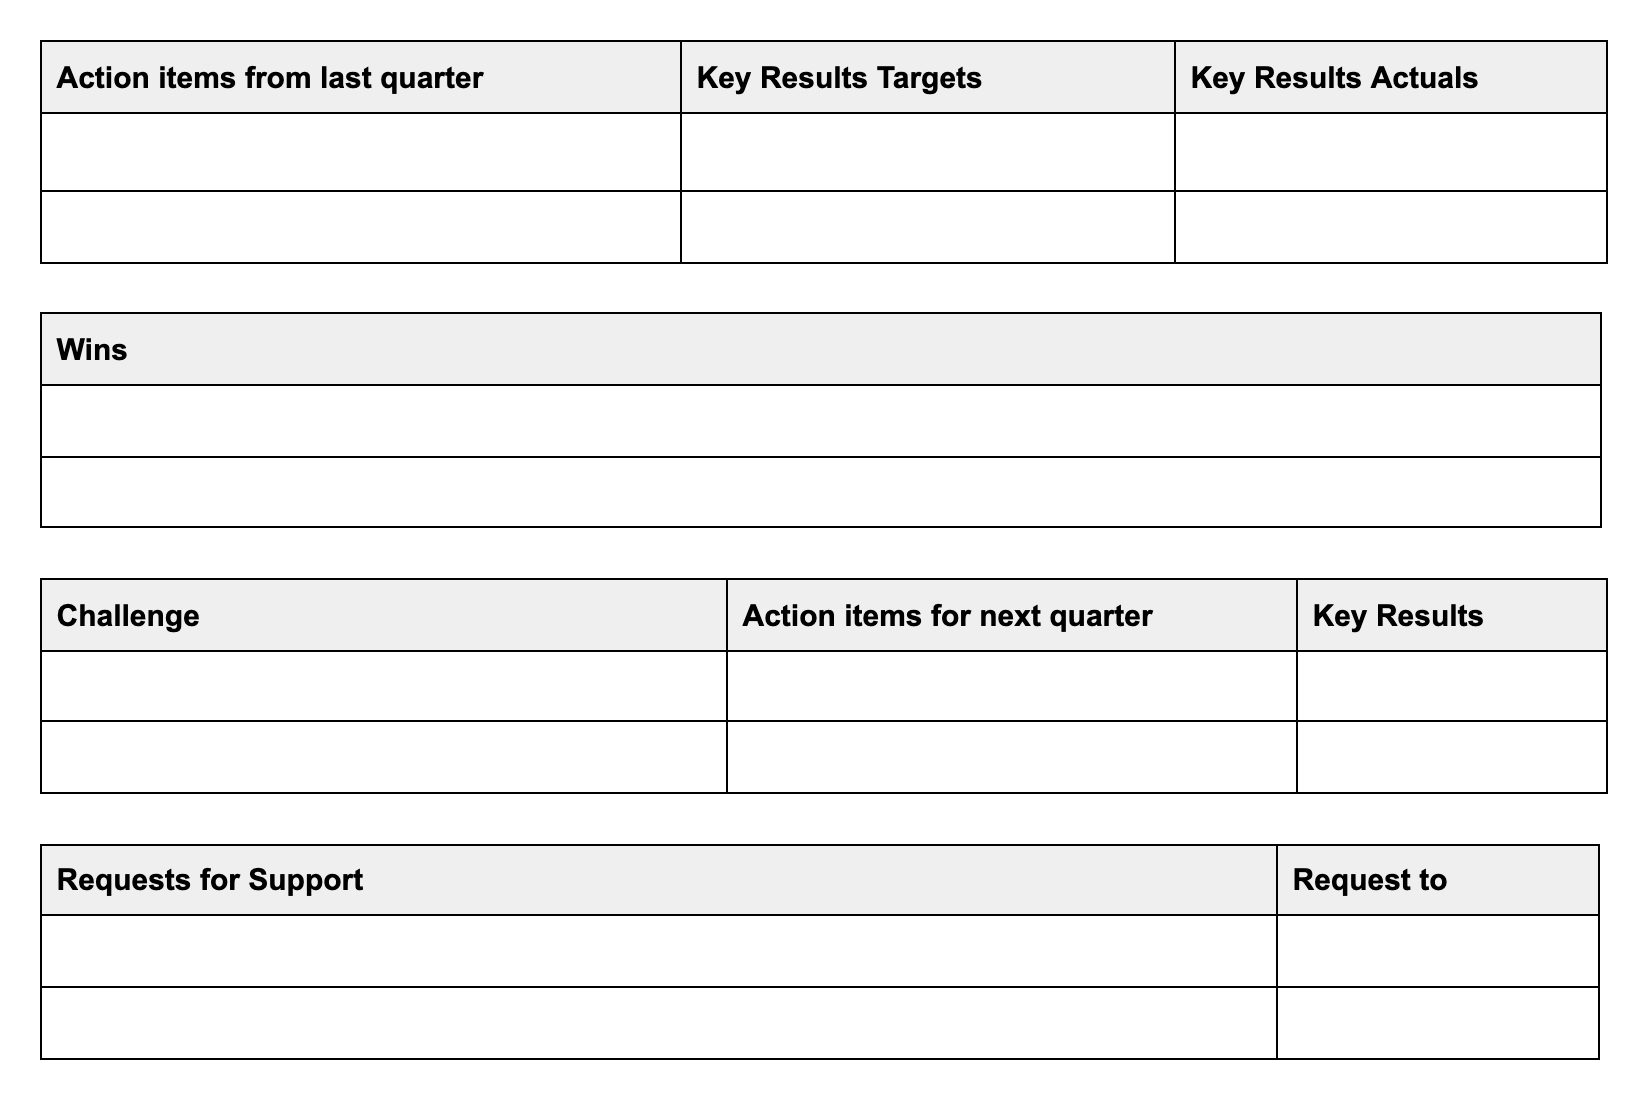
Every quarter we review progress on scorecards in quarterly business reviews (QBRs). The scorecard measures are updated with the previous quarter's results, then the leadership team reflects on Wins, Action Items, and Requests for Support (WAR tables). Here is the scorecard table format:

Scorecards and WAR tables are very similar to OKRs; in fact they use the same objective and key results construct. The reason we use scorecards and WAR tables rather than just OKRs is because this format emphasizes the ritual of review more than the act of setting goals. Too often OKRs are set and then never reviewed, which defeats the purpose of setting goals. For our operating cadence, we want it to be a cadence — something we come back to frequently to keep us on track, keep us reflecting, and keep us improving. Here is the WAR tables format:

The full scorecard template can be found here.
Ritual: Quarterly Business Reviews (QBRs)
Each QBR is 30 minutes and dedicated to reviewing those WAR tables. The audience is the executive team (all CEO direct reports) and extended leadership team (all VPs), which is about 30 people. The scorecard documents are sent out before for pre-reading, so the presenters review the WAR tables efficiently and then respond to questions.
The quarterly process embodies the second principle of "reflection, not perfection". We honestly review performance and identify areas that need improvement. Those action items are followed up on the next quarter and teams are held accountable for results. Additionally, the executive team has the right level of detail across the scorecards to surface patterns and cross-functional challenges. We find leveraged actions to address those challenges (the third principle from above - find and enact leverage).
Weekly
Source of Truth: Corporate Reporting Pack
The corporate reporting pack defines our primary lagging and leading key performance indicators (KPIs). It is a super set of the metrics in the scorecards.
Ritual: Weekly Executive Team Meeting
Every week we update the metrics in the corporate reporting pack and assess if any metrics are off track. We summarize those insights and review them in our weekly executive team meeting. This level of weekly scrutiny keeps us on track to delivering our high-leverage actions. We need to stay focused on enacting impactful improvements and not getting distracted by the flow of urgent, low-leverage escalations.
Stages of Operating Cadence Maturity
Building an operating cadence takes time. It takes making mistakes, fixing those mistakes, and consistently improving the system. It is a product to continuously improve. So far we've seen the operating cadence go through two stages and we're eyeing a third.
Stage One: Observing lagging indicators
The first step is defining high-level company success metrics. For us that's our North Star goals. The North Star goals are big, ambitious goals that are the result of years of execution. They are very much lagging indicators that are almost useless to track quarterly, and certainly not useful to track weekly. The North Stars are scaffolding and a great starting point. But they need to be developed into leading indicators that employees have more direct influence over.
Stage Two: Leveraged leading indicators
Identifying which leading indicators have the most influence on reaching long-term objectives takes time. It takes going through many iterations of QBRs to find patterns, think through potential solutions, and determine quantifiable measures for those solutions. Once those leading indicators are identified, they get tracked in scorecards.
Stage Three: Complex systems design
All quantifiable metrics can be gamed. Prioritizing one metric will have an impact on another. The ideal outcome is designing a complex system with positive reinforcing loops.

